UT NEWS & Updates
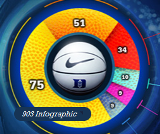
Anatomy of Making the 903 Infographic
 Since the launch of 903andCounting.com, we’ve received a lot of great positive feedback on the “903 Infographic”, so in this post we run through some of the details on how it was created.
The Process:
Step One: Stats
First thing we did was work with our guys at Duke to put together a list of stats on Coach K’s career. The size of the infographic turned out to be pretty long, but with the depth of Coach K’s career it really could have been twice as long.
Step Two: Category Breakout
We felt the best way to display the content would be to separate all the stats out in to categories. Most fell into groups right away, but by the end we were going back and forth between having 9 to 12 categories before settling on 10.
Step Three: Stats Verification
Perhaps the toughest part of the whole process was making sure all the stats we selected to use were correct and verified (and also updated, because they changed for each of the 3 games played). Actually expected a few data entry errors on the total points and total margin (entering in over 1,800 cells of numbers was brutal), but every single input was correct. Right up until 5 minutes remaining in the game we continued to check all the stats, even having to change one at the last minute.
Step Four: Wording
The design team truly hated this part. We started out with two major changes before sending it to the design phase, but proceeded to change wording and grammar about 10 more times after seeing the final design before we gave it the green light to be added to the site.
Step Five: Design
Started off by going through each category and making a list of related graphics. Then made a list of misc images to be possibly integrated in throughout the design. From there we let lead designer, Jason Yapp, have it and do his magic. In the end, we really only had two major changes and we knew right away the combination of content and design was going to meet our initial “showcase” goal.
www.903andcounting.com/infographic

Feedback:
Some of the feedback we received on twitter included:
titanjBj21
This is just jaw dropping RT @darrenrovell: An amazing Coach K Infographic sprts.bz/CoachKInfo(H/T @stillundisputed)
Jammerson39
Not a duke fan, but gotta respect coach K. RT @darrenrovell: An amazing Coach K Infographic sprts.bz/CoachKInfo (H/T@stillundisputed)
JamesJanssen
Pretty amazing really “@darrenrovell: An amazing Coach K Infographic sprts.bz/CoachKInfo(H/T @stillundisputed)”
CincinnatiLite
@darrenrovell @stillundisputed Not really a K fan but that graphic is staggering. Wow. #Respect
GregYaghmai
Really cool graphic RT @darrenrovell: An amazing Coach K Infographic sprts.bz/CoachKInfo(H/T @stillundisputed)
matthewsdowns
This is awesome. RT @darrenrovell: An amazing Coach K Infographic sprts.bz/CoachKInfo(H/T @stillundisputed)
aschmidty33
Love this!! RT @darrenrovell: An amazing Coach K Infographicsprts.bz/CoachKInfo (H/T @stillundisputed)
Evan_VMG
Wow RT “@darrenrovell: An amazing Coach K Infographicsprts.bz/CoachKInfo (H/T @stillundisputed)”
getcarter2517
Wow. I wish I were good at graphic design RT @darrenrovell: An amazing Coach K Infographic sprts.bz/CoachKInfo (H/T@stillundisputed)
darrenrovell
An amazing Coach K Infographic sprts.bz/CoachKInfo (H/T@stillundisputed)


